Free Daily Podcast Summary
Waterlines: How Water Shapes Our World: Daily Summaries Delivered
by jaywen
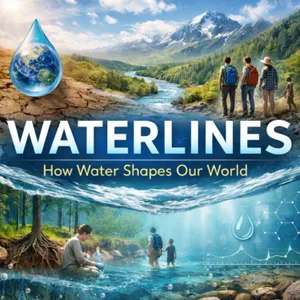
✦ Waterlines: How Water Shapes Our World ✦ explores the hidden role of water in shaping our planet, ecosystems, and daily lives. Each episode turns advanced water science into engaging, everyday conversations Designed for curious listeners — no scientific background required — the show features researchers, field stories, and real-world challenges that reveal why water matters more than we think. Whether you’re interested in the environment, climate, or how science connects to society, Waterlines helps you see the world through the lens of water.
Latest Episodes
The most recent episodes — sign up to get AI-powered summaries of each one.
- 2 days ago11 min
When Satellites Swap: Keeping the Snowpack Record Honest
Takeaway: When a snow-monitoring satellite is replaced, scientists have to make sure a jump in the record is real snow, not a new ruler in space.Snow is not just winter scenery; it is stored water. In the North Central U.S., the amount of water locked in snow can shape spring flooding, farm planning, river forecasts, and the way communities read climate trends. But long-term snow records depend on satellites that do not last forever. This episode follows a practical scientific problem: when one microwave satellite sensor hands the job to another, how do we know a change in measured snow water is really in the snowpack, and not in the instrument?We unpack snow water equivalent—the depth of water you would get if a snowpack melted—and why satellites estimate it by listening for faint microwave signals from snow grains. Then we walk through how Cho, Tuttle, and Jacobs compared generations of passive microwave sensors over 1,176 watersheds in the North Central U.S., using overlapping satellite records like stepping-stones across gaps in time. Their results show that AMSR-E and AMSR2 were consistent enough to be treated as one continuing record for many uses, while SSM/I and SSMIS showed larger differences, especially in forested snow regions. The message is careful but important: before we use decades of satellite snow data for flood forecasts or climate analysis, we need to check the ruler.Citation: Cho, E.; Tuttle, S.E.; Jacobs, J.M. Evaluating Consistency of Snow Water Equivalent Retrievals from Passive Microwave Sensors over the North Central U.S.: SSM/I vs. SSMIS and AMSR-E vs. AMSR2. Remote Sensing 2017, 9, 465. https://doi.org/10.3390/rs9050465.Disclosure: This Waterlines episode package is written for public science communication and uses AI-generated voices for the host conversation.
- 5 days ago11 min
Reading a Watershed’s Hidden Water by Watching Its Stream
Takeaway: A stream can tell us about more than runoff; its rises and falls can help reveal how much hidden water the whole watershed is losing to the air.Every water plan depends on a hard-to-see number: how much water leaves the land not as streamflow, but as invisible vapor from soil, leaves, grass, crops, and forests. That loss, evapotranspiration, shapes drought, irrigation demand, ecosystem stress, and climate feedbacks—but direct measurements are scarce. This episode follows a clever attempt to estimate that invisible water use with records many places already have: rain, streamflow, and basic weather data.Hosts unpack how Tuttle and Salvucci built a simple watershed-scale model around one practical idea: a wetter watershed should usually have both more streamflow and more efficient evaporation and plant water use. By integrating a water balance through time, the model infers storage—the hidden water held in soils, shallow groundwater, surface water, and vegetation—and then chooses its key parameter by finding when inferred storage best lines up with observed streamflow. Tested across nine U.S. watersheds linked to AmeriFlux sites, the model often tracked measured daily evapotranspiration well, especially in arid and semiarid places where water availability strongly controls plant and soil water loss.We also talk about the caution flags: humid watersheds can be more energy-limited than water-limited, a single flux tower may not represent a whole basin, stream gauges and rain records have errors, and dams, irrigation, crops, lawns, and groundwater movement can complicate the story. The result is not a magic water meter, but a useful example of how hydrologists squeeze insight from everyday observations.Citation: Tuttle, S. E., and G. D. Salvucci (2012), A new method for calibrating a simple, watershed-scale model of evapotranspiration: Maximizing the correlation between observed streamflow and model-inferred storage, Water Resources Research, 48, W05556, doi:10.1029/2011WR011189.Disclosure: This Waterlines episode package is written for production with AI-generated voices.
- 6 days ago11 min
A Better Count of the Water Hidden in Snow
Takeaway: A thin change in soil moisture can make an aircraft misread the water in a snowpack, so a satellite check before freeze-up can sharpen flood forecasts.Spring flooding can hinge on a surprisingly small question: how much water is actually sitting in the snow before it melts? In the northern Great Plains and parts of southern Canada, forecasters have long used low-flying aircraft to estimate snow water by reading how natural gamma rays from the soil are muted by snow. This paper asks whether a NASA soil-moisture satellite can help those airborne snow surveys avoid a quiet source of error: the ground itself getting wetter or drier after the fall “baseline” flight.In this episode, we follow the path from frozen farm fields to satellite pixels to river forecast offices. We unpack snow water equivalent—the meltwater stored in snowpack—why it matters for flood warnings, and how the NOAA airborne gamma survey works without turning the story into a physics lecture. The study finds that SMAP soil moisture data can improve gamma-based snow estimates in non-forested areas, with typical corrections around 10 millimeters of water—small on a ruler, but meaningful when broad, flat basins are close to flooding.We also talk through the caveats: satellites struggle under forests, different sensors “see” different soil depths, and a flight line is not the same size as a satellite grid cell. The result is a grounded look at how better measurements—not bigger headlines—can improve the everyday public science behind flood preparedness.Citation: Cho, E., Jacobs, J. M., Schroeder, R., Tuttle, S. E., & Olheiser, C. (2020). Improvement of operational airborne gamma radiation snow water equivalent estimates using SMAP soil moisture. Remote Sensing of Environment, 240, 111668. https://doi.org/10.1016/j.rse.2020.111668Disclosure: This Waterlines episode package is written for AI-generated host voices; the voices listeners hear are AI-generated.
- 1 weeks ago11 min
When Wet Ground Seems to Summon Rain
Takeaway: Wet soil can look like it is calling the rain, but scientists have to separate that signal from seasons and lingering storms before they can trust the story.Rainfall forecasts, drought planning, wildfire risk, and climate models all depend on a deceptively simple question: does wet soil help make tomorrow’s rain, or are we just seeing the leftovers of yesterday’s storm? This episode follows a paper that acts like a scientific caution sign. Tuttle and Salvucci show that the land-atmosphere connection is real and important, but it is easy to fool ourselves if we do not separate true feedback from seasonal cycles, multi-day storms, and statistical bias. We unpack Granger causality as a practical test of whether one thing improves prediction of another, then translate the paper’s three big traps into everyday examples: summer patterns, storm systems that linger, and the problem of soil moisture being both cause and consequence. Along the way, we talk about why this matters for models, satellite data, weather risk, and the way scientists build confidence without overclaiming. Citation: Tuttle, S. E. and G. D. Salvucci (2017), Confounding factors in determining causal soil moisture-precipitation feedback, Water Resources Research, 53, 5531–5544, doi:10.1002/2016WR019869. This episode uses AI-generated voices for the hosts.Full citation: Tuttle, S. E. and G. D. Salvucci (2017), Confounding factors in determining causal soil moisture-precipitation feedback, Water Resour. Res., 53, 5531–5544, doi:10.1002/2016WR019869.
- 1 weeks ago11 min
Can Wet Soil Help Make Tomorrow’s Rain? A U.S. Weather Feedback Story
Takeaway: The ground can nudge tomorrow’s rain, but in this study wet soil helped rain chances in much of the dry West and often worked the other way in the humid East.Rain does not only fall from the sky; it also leaves a memory in the ground. That matters for drought forecasts, flood risk, farming decisions, and how climate models represent the daily conversation between land and atmosphere. In this episode of Waterlines, we explore a study that asked a deceptively simple question: after it rains and the soil changes, can that soil moisture make the next rain more—or less—likely?Using satellite soil-moisture observations, rain-gauge-based precipitation data, and a careful statistical approach designed to separate cause from coincidence, Samuel Tuttle and Guido Salvucci found a striking U.S. pattern. In much of the drier West, wetter-than-usual soils tended to raise the odds of next-day rain, while drier soils lowered them. In much of the more humid East, the feedback often flipped: drier soils were linked to higher rain probability, and wetter soils to lower probability. Across the contiguous United States, significant feedback appeared over about 38% of the land area, with soil moisture changing rainfall probabilities by a median factor of 13% where the signal was significant.We unpack why this is not as simple as “wet ground makes rain.” Soil moisture changes how sunlight is split between evaporation and heating the air, shaping humidity, temperature, and the growth of the lower atmosphere. But storms also have their own momentum, seasons have their rhythms, and yesterday’s rain naturally leaves today’s soil wet. The episode walks through how the researchers tried to avoid mistaking weather persistence for land feedback, what the east-west contrast may reveal about arid and humid climates, and why the Great Plains result was especially interesting.Citation: Tuttle, S., and Salvucci, G. “Empirical evidence of contrasting soil moisture–precipitation feedbacks across the United States.” Science 352(6287), 825–828 (2016). https://doi.org/10.1126/science.aaa7185Disclosure: This Waterlines episode uses AI-generated voices for the hosts.Full citation: Tuttle, S., and Salvucci, G. “Empirical evidence of contrasting soil moisture–precipitation feedbacks across the United States.” Science 352(6287), 825–828 (2016). DOI: 10.1126/science.aaa7185
- 2 weeks ago12 min
When Satellites Watch Rivers Rise and Fields Dry: Seeing Floods and Droughts Before They Become Disasters
Takeaway: Satellites do not replace people on the ground, but they can show the shape of missing or overflowing water when gauges are too few, too late, or too far apart.Floods can arrive overnight; droughts can creep in for months before anyone agrees what to call them. This episode matters because communities, farmers, emergency managers, insurers, and water planners all need the same thing: a clearer picture of where water is, where it is missing, and how fast conditions are changing. We explore how satellites help fill the gaps between river gauges, rain stations, soil probes, and field reports—especially in places where ground data are sparse or disasters unfold across huge regions.Using the edited scientific volume Remote Sensing of Hydrological Extremes as our guide, we unpack how different satellites “see” water: optical sensors that spot dark floodwater, microwave instruments that can work through clouds, radar that detects flooded forests, gravity missions that weigh changes in underground and surface water storage, and vegetation signals that reveal drought stress in crops and ecosystems. We visit examples from the Magdalena River in Colombia, snowmelt flooding in the Red River of the North, NASA global flood maps, Congo floodplain hydraulics, Southeast Asia flood impacts, and drought monitoring in Brazil, China, and the western United States.We also keep the science honest: satellite maps can miss water under trees, confuse cloud shadows with floods, struggle with coarse pixels, or need careful calibration with models and field data. But when used thoughtfully, they can turn scattered clues into practical warning and recovery information.Citation: Lakshmi, V. (ed.). Remote Sensing of Hydrological Extremes. Springer Remote Sensing/Photogrammetry. Springer International Publishing Switzerland, 2017. https://doi.org/10.1007/978-3-319-43744-6Disclosure: This Waterlines episode package is designed for production with AI-generated voices.
- 2 weeks ago11 min
How Rain Can Check a Satellite’s Soil Moisture Map
Takeaway: A satellite soil-moisture map is more trustworthy when rainy days and wet ground line up in the pattern real soils naturally make.Flood warnings, drought outlooks, farm decisions, and climate models all depend on a deceptively simple question: how wet is the ground? Satellites can scan huge areas that no field crew could visit every day, but their soil-moisture maps are hard to check because a satellite pixel covers many kilometers while a ground sensor samples one small spot. This episode explores a clever workaround: instead of asking whether a satellite matches scattered soil probes, the researchers ask whether its wet-and-dry pattern makes sense when compared with large-scale rainfall.We unpack how soil moisture sits at the busy meeting place between rain, runoff, evaporation, plant water use, and heat. Then we follow the paper’s main idea: over time, real soils leave a recognizable fingerprint. Dry ground tends to be linked with lower recent rainfall, wet ground with higher rainfall, and the curve between them has a distinctive S-like shape because drainage, runoff, and evaporation respond differently as soils fill. If a satellite product scrambles that relationship, it may be carrying more error. The authors used a statistic called mutual information, explained here as a way to measure how much two messy datasets “know” about each other, to compare three AMSR-E satellite soil-moisture products across the contiguous United States from 2002 to 2011.The result is not one universal winner. The University of Montana product carried the most useful rainfall-linked information across about 50 percent of the region, the VUA-NASA product across about 47 percent, and the NASA product across about 3 percent. The better-performing product also depended on landscape: flatter, less vegetated areas tended to favor the University of Montana product, while more rugged or more vegetated areas often favored VUA-NASA. The study also found winter and frozen-ground behavior that needs care, reminding us that satellite data are powerful but not magic.Citation: Tuttle, S. E., & Salvucci, G. D. (2014). A new approach for validating satellite estimates of soil moisture using large-scale precipitation: Comparing AMSR-E products. Remote Sensing of Environment, 142, 207–222. https://doi.org/10.1016/j.rse.2013.12.002Disclosure: This Waterlines episode package is written for public-science listening and uses AI-generated voices.
- 2 weeks ago11 min
How Satellites Catch Snow in the Act of Melting and Refreezing
Takeaway: A snowpack can look still, but its microwave glow changes when it flips between frozen storage and liquid water.Spring runoff, flood risk, irrigation water, forest timing, and even winter wildlife can all hinge on a quiet moment: when snow first starts turning to liquid water, then freezing again overnight. This episode follows a study that improves how satellites spot those freeze-thaw pulses from space. Instead of treating every day-night change in microwave signal as melt, the researchers ask a practical question: how much of that signal is just the snow and land getting warmer, and how much is actually water changing phase?We unpack how passive microwave satellites “see” snow, why wet snow suddenly looks brighter in microwave measurements, and why air temperature can help separate ordinary warming from real melt and refreeze. The conversation travels from a flat farm-country satellite pixel in the Northern Great Plains to Colorado’s Senator Beck Basin, where snow surface temperature and energy-balance instruments help test whether the satellite detections make physical sense. Along the way, we talk about why this matters for spring streamflow forecasts, snowpack models, climate records, and the everyday water supply that begins as mountain snow.Citation: Tuttle, S. E., & Jacobs, J. M. (2019). Enhanced identification of snow melt and refreeze events from passive microwave brightness temperature using air temperature. Water Resources Research, 55, 3248–3265. https://doi.org/10.1029/2018WR023995Disclosure: This Waterlines episode uses AI-generated voices for the hosts.
About Waterlines: How Water Shapes Our World
✦ Waterlines: How Water Shapes Our World ✦ explores the hidden role of water in shaping our planet, ecosystems, and daily lives. Each episode turns advanced water science into engaging, everyday conversations Designed for curious listeners — no scientific background required — the show features researchers, field stories, and real-world challenges that reveal why water matters more than we think. Whether you’re interested in the environment, climate, or how science connects to society, Waterlines helps you see the world through the lens of water.
Customized Recaps
AI-powered recaps with compact key takeaways, quotes, and insights.
Straight to Your Inbox
Get key takeaways from Waterlines: How Water Shapes Our World in a 5-minute read.
Save Hours Every Week
Stay current on your favorite podcasts without falling behind.
Frequently Asked Questions
What is Podzilla's Waterlines: How Water Shapes Our World daily summary?
It's a free AI-powered email that summarizes new episodes of Waterlines: How Water Shapes Our World as soon as they're published. You get the key takeaways, notable quotes, and links & mentions — all in a quick read.
How does the Waterlines: How Water Shapes Our World podcast summary work?
When a new episode drops, our AI transcribes and analyzes it, then generates a personalized summary tailored to your interests and profession. It's delivered to your inbox every morning.
Is this an official Waterlines: How Water Shapes Our World product?
No. Podzilla is an independent service that summarizes publicly available podcast content. We're not affiliated with or endorsed by jaywen.
Can I get summaries of other podcasts too?
Absolutely! The free plan covers up to 3 podcasts. Upgrade to Pro for 15, or Premium for 50. Browse our full catalog at /podcasts.
How often does Waterlines: How Water Shapes Our World release new episodes?
Waterlines: How Water Shapes Our World publishes every few days. Our AI generates a summary within hours of each new episode.
What topics does Waterlines: How Water Shapes Our World cover?
Waterlines: How Water Shapes Our World covers topics including Science, Earth Sciences. Our AI identifies the specific themes in each episode and highlights what matters most to you.
Start getting Waterlines: How Water Shapes Our World summaries tomorrow morning.
Free forever for up to 3 podcasts. No credit card required.
Free forever for up to 3 podcasts. No credit card required.