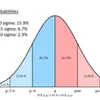
Hi everyone - this is Alf. I hope you're having a great day.‘’I compile statistics on my traders. My best trader makes money only 63 percent of the time. Most traders make money only in the 50 to 55 percent range. That means you’re going to be wrong a lot. If that’s the case, you better be sure your losses are as small as they can be, and that your winners are bigger.’’ – Steve Cohen.This is a hard truth to accept for many macro investors: we will be right only about 50-55% of the times.If your win rate is much higher than this, I suggest you extend the sample of trades you are analyzing or assess whether you are not trading macro but rather just selling optionality – short vol/option strategies have win rates as high as 90%+, but they wipe you out completely when you are wrong.In the last 10 years, I scored a 52% long-term win rate on my directional macro trades. Once I realized that and given that the year-end P&L formula can be written as follows:I knew I’d better make sure the size of my losses doesn’t get out of control.This can be achieved in two ways: sizing trades correctly and designing a system that lets your winners run. We are going to talk about my approach to both angles in a second, but first another important remark.To step up the win rate on macro trades from 50% to say 55% over a long period of time, you need to gain some edge over other macro investors.What could that be?- A data-driven approach with superior macro models- The ability to assess the gigantic amount of cross-asset market signals via quantitative tools- A particular edge in a niche market that you have learnt to navigate well over time- Be less stupid than othersMacro models help a lot, but my ‘’don’t be stupid checklist’’ adds value too:Points 1-3 keep my emotions in check and ground me to a more rational assessment of the trade.Points 4-6 are about implementation.A warning: short carry trades (and long options) are expensive to hold over time if nothing happens.A reminder: in very choppy markets, you can get quickly stopped out with linear trades even if your thesis proves to be correct – consider whether the market regime favors linear or option implementations.Don’t be stupid: check whether the trade you are about to add is not just another expression of a trade you already have on – I have seen people blow up as the 10 trades they were running were just…the same trade.But it’s point 7 that sticks out: sizing and risk management define most of your P&L at year-end.Here is how I approach them through a practical example. Say you think that the S&P500 will keep marching higher over the next month: how many SPYs do you buy?You could be in the right or left 50% of that distribution: when you pull the trigger, you don’t know that. And because you don’t know that, you want to standardize your ex-ante sizing.One effective way to standardize the sizing of each tactical trade so that they don’t excessively weigh on your year-end P&L is to do volatility-adjusted sizing: let’s go through the SPY example.You could be in the right or left 50% of that distribution: when you pull the trigger, you don’t know that. And because you don’t know that, you want to standardize your ex-ante sizing.One effective way to standardize the sizing of each tactical trade so that they don’t excessively weigh on your year-end P&L is to do volatility-adjusted sizing: let’s go through the SPY example.Let’s set our stop at 1.5 standard deviations, and our defined time horizon in this example will be 1 month. For the SPY, using a 5-year lookback the typical 1.5x monthly negative sigma event would be a -7.6% decline.You can play around with the lookback period if you want more history and/or assign different weight to more recent periods if you think today’s vol regime is more relevant (grey boxes).If returns are normally distributed, we will be stopped out 6.7% of the times in our defined time horizon. But as returns often follow other distributions, it’s good practice to check the actual empirical probability of being stopped out against the theoretical 6.7% probability (orange boxes).Finally, define what’s the fixed % of AuM you are willing to lose on any given macro trade.A fictitious $1 million trading account willing to lose max $20k per trade which is bullish on SPY with a 1- month horizon would buy 571 SPY shares at $437 and be stopped out at $402 (-7.6% = 1.5x sigma event) hence losing $20k (= 2% of AuM).Congratulations, you just applied volatility-adjusted position sizing!What are the advantages of this appro
Podzilla Summary coming soon
Sign up to get notified when the full AI-powered summary is ready.
Free forever for up to 3 podcasts. No credit card required.

Get summaries like this every morning.
Free AI-powered recaps of The Macro Compass and your other favorite podcasts, delivered to your inbox.
Free forever for up to 3 podcasts. No credit card required.